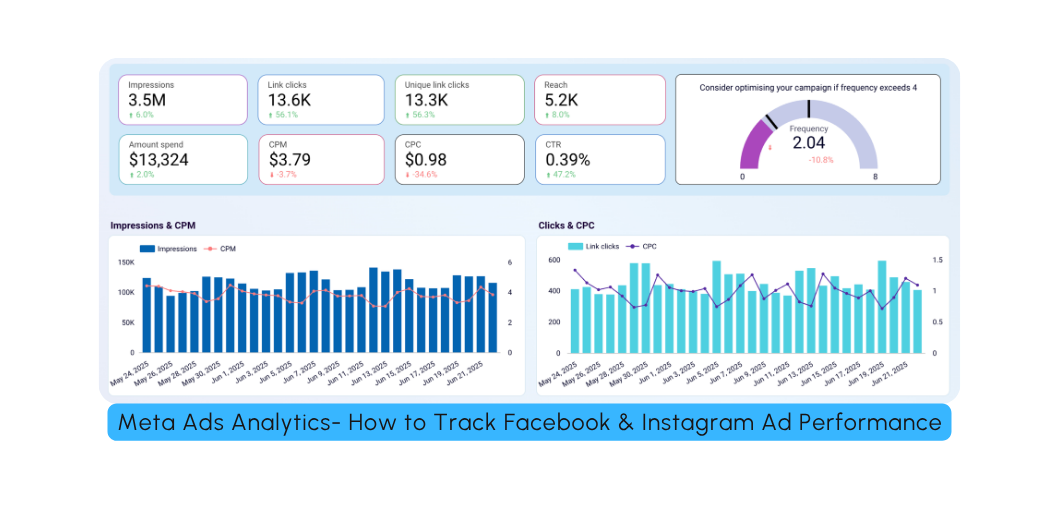
Meta Ads Analytics: How to Track Facebook & Instagram Ad Performance in 2026
Introduction
Are your Facebook and Instagram advertisements generating results, or are you simply spending money without knowing what works?
Many businesses monitor likes, comments, clicks and impressions. While these metrics can provide useful information, they don’t always reveal whether advertising is contributing to business growth.
For example, an advertisement might generate hundreds of clicks but very few enquiries. Another might attract fewer visitors but generate more qualified leads and paying customers.
This is why Meta Ads analytics matters.
By tracking the right metrics, you can understand how people respond to your advertisements, identify problems in the customer journey and make better decisions about your advertising budget.
In this guide, you’ll learn how to measure Facebook and Instagram advertising performance in 2026, understand the most important metrics and build a practical reporting system for your business.
Whether you run a local business in Kolkata, manage an e-commerce store or provide digital marketing services, these principles can help you evaluate advertising more effectively.
What Is Meta Ads Analytics?
Meta Ads analytics is the process of collecting, interpreting and evaluating advertising data to understand campaign performance.
It involves examining information about:
- Advertising expenditure
- Reach and impressions
- Clicks and engagement
- Audience response
- Website visits
- Leads and enquiries
- Purchases and revenue
- Cost per result
- Conversion rates
- Return on advertising spend
The goal isn’t to collect as many numbers as possible.
The goal is to understand which numbers help you make better business decisions.
For example, if your objective is lead generation, your primary focus should include qualified leads and customer acquisition cost—not just video views.
If you operate an online store, purchase volume, revenue, contribution margin and profitability may be more important.
Good analytics connects advertising activity with business outcomes.
Why Is Meta Ads Analytics Important?
Without reliable measurement, it’s difficult to determine whether your campaigns are working as intended.
Analytics can help you:
- Identify advertisements that attract relevant customers.
- Understand how much you spend to generate leads.
- Compare creative variations.
- Detect problems with landing pages.
- Evaluate audience quality.
- Monitor advertising costs.
- Measure reported purchases and revenue.
- Make informed budget decisions.
- Improve reporting for clients or management.
- Understand the limitations of platform-reported results.
However, analytics doesn’t automatically improve campaign performance. You still need to interpret the data correctly and take appropriate action.
1. Understand Meta Ads Manager
Meta Ads Manager is the main interface advertisers use to manage campaigns and review advertising performance.
You can use it to examine campaign delivery, results, expenditure and available performance metrics.
The interface and available reporting options may change over time, but the basic reporting structure remains organized around three levels.
| Level | What It Shows |
|---|---|
| Campaign | Overall campaign performance |
| Ad Set | Performance associated with an audience, budget and placement configuration |
| Ad | Performance of individual advertisements and creative variations |
Campaign-Level Analysis
Use campaign-level reporting to understand the overall performance of a marketing objective.
Questions to ask:
- How much have we spent?
- How many reported results did we receive?
- What is the cost per result?
- Is the campaign meeting its business objective?
Ad Set-Level Analysis
Use ad set reporting to compare audience strategies and other settings.
Questions to ask:
- Which audience is generating useful results?
- Is the budget distributed appropriately?
- Are some ad sets generating irrelevant leads?
Ad-Level Analysis
Use ad-level reporting to compare creative performance.
Questions to ask:
- Which advertisement attracts attention?
- Which creative generates enquiries?
- Which message produces qualified customers?
- Is performance changing over time?
Avoid drawing conclusions from a single metric without considering the campaign objective and available data.
2. Reach vs Impressions
Reach and impressions are two fundamental advertising metrics.
What Is Reach?
Reach measures the number of people or accounts who saw your content or advertisement, according to the platform’s reporting methodology.
For example, an advertisement may reach 5,000 people.
What Are Impressions?
Impressions measure how many times an advertisement was displayed.
If the advertisement receives 15,000 impressions, it was displayed 15,000 times according to the reporting system.
The same person may account for multiple impressions.
Example
| Metric | Result |
|---|---|
| Reach | 5,000 |
| Impressions | 15,000 |
The advertisement generated three impressions per person reached on average.
This leads to another useful metric.
3. Understand Ad Frequency
Frequency represents the average number of times an advertisement was shown to each person reached during the selected reporting period.
A simplified calculation is:
Frequency = Impressions ÷ Reach
Using the previous example:
15,000 ÷ 5,000 = 3
The average frequency is 3.
Frequency can help you understand how often your audience encounters your advertisement.
However, there is no single ideal frequency for every campaign.
The appropriate level depends on factors such as:
- Campaign objective
- Audience size
- Campaign duration
- Creative quality
- Product or service
- Advertising budget
- Audience response
When Should You Investigate Frequency?
Consider reviewing your campaign if frequency increases while engagement or conversion performance declines.
This combination may indicate creative fatigue, although other factors could also be responsible.
Don’t automatically pause a campaign simply because frequency reaches a particular number.
4. What Is CPM?
CPM stands for Cost Per Thousand Impressions.
It measures the advertising cost associated with every 1,000 impressions.
Formula
CPM = Advertising Spend ÷ Impressions × 1,000
Example
Advertising spend: ₹3,000
Impressions: 60,000
CPM = ₹3,000 ÷ 60,000 × 1,000
CPM = ₹50
This means the campaign spent ₹50 per 1,000 impressions.
CPM can help you understand the cost of delivering advertisements, but it doesn’t tell you whether those impressions generated meaningful business results.
A low CPM isn’t automatically better if the campaign attracts an irrelevant audience.
Read Also:- Meta Ads Campaign Setup: Step-by-Step Guide
5. What Is CTR?
CTR stands for Click-Through Rate.
It measures the percentage of impressions that resulted in the type of click being measured.
Meta reporting can distinguish between different click metrics, so make sure you use the appropriate CTR definition for your analysis.
For link click-through rate, the simplified formula is:
Link CTR = Link Clicks ÷ Impressions × 100
Example
Impressions: 20,000
Link clicks: 400
Link CTR = 400 ÷ 20,000 × 100
Link CTR = 2%
This means 2% of impressions resulted in a link click under this calculation.
What Does CTR Tell You?
CTR can help you evaluate whether an advertisement encourages people to click.
A low CTR may indicate that:
- The creative isn’t attracting attention.
- The message isn’t relevant.
- The offer isn’t clear.
- The audience may be poorly matched.
- The CTA needs improvement.
But CTR alone cannot identify the cause.
You should also review landing-page visits, conversion rates and lead quality.
6. What Is CPC?
CPC stands for Cost Per Click.
For a specific click metric, the calculation is:
CPC = Advertising Spend ÷ Number of Relevant Clicks
Example
Advertising spend: ₹2,000
Link clicks: 250
CPC = ₹2,000 ÷ 250
CPC = ₹8
This means the campaign spent ₹8 per link click.
Make sure you’re comparing the same click type across campaigns.
For example, link clicks and all clicks are not interchangeable metrics.
Why CPC Matters
CPC helps you understand how much you’re paying to generate clicks.
However, cheap clicks aren’t necessarily valuable.
If your campaign generates inexpensive clicks but very few qualified enquiries, you may need to investigate audience relevance, creative messaging or the landing page.
7. Landing Page Views vs Link Clicks
A person clicking an advertisement doesn’t necessarily mean they successfully loaded your website.
The user might leave before the page loads, experience a connection problem or close the browser.
This is why comparing link clicks with landing page views can be useful when those metrics are available.
Example
| Metric | Result |
|---|---|
| Link clicks | 500 |
| Landing page views | 350 |
The difference is 150.
Possible explanations include page-loading problems, incomplete visits, measurement differences or other technical factors.
Don’t assume every missing landing page view is caused by a slow website. Investigate the data and test the actual user experience.
What to Check
- Mobile page speed
- Broken links
- Redirects
- Browser compatibility
- Tracking implementation
- Landing-page usability
- Internet connection requirements
A technically sound landing page helps visitors complete the journey after clicking an advertisement.
8. What Is Cost Per Lead?
Cost per lead, or CPL, is one of the most useful metrics for lead-generation campaigns.
Formula
CPL = Advertising Spend ÷ Number of Leads
Example
Advertising spend: ₹10,000
Leads generated: 50
CPL = ₹10,000 ÷ 50
CPL = ₹200
The campaign spent ₹200 per lead.
But here’s the important part: a low CPL doesn’t guarantee good business performance.
Suppose one campaign generates 100 irrelevant leads, while another generates 30 qualified leads.
The campaign with fewer leads may provide more commercial value.
Therefore, separate the following metrics whenever possible:
- Cost per lead
- Cost per qualified lead
- Cost per appointment
- Cost per customer
These measurements give you a clearer picture of campaign effectiveness.
9. Understand Conversion Rate
Conversion rate measures the proportion of people who completed a desired action.
The denominator depends on the conversion journey you’re measuring.
For a website landing page, you might calculate:
Landing Page Conversion Rate = Conversions ÷ Landing Page Visits × 100
Example
Landing page visits: 1,000
Enquiries: 40
Conversion rate = 40 ÷ 1,000 × 100
Conversion rate = 4%
This is an illustrative example, not a benchmark for every industry.
A conversion rate can vary depending on the product, price, traffic quality, offer and buying journey.
What If Your Conversion Rate Is Low?
Investigate:
- Whether the advertisement matches the landing page
- Whether the offer is clear
- Whether the page works on mobile
- Whether the form is too complicated
- Whether the CTA is visible
- Whether visitors trust the business
- Whether the audience is relevant
Don’t assume the advertising campaign is the only problem.
10. What Is Customer Acquisition Cost?
Customer acquisition cost, or CAC, measures the cost of acquiring a new customer.
A simplified advertising calculation is:
Advertising CAC = Advertising Spend ÷ New Customers Acquired
Example
Advertising spend: ₹15,000
New customers acquired: 5
Advertising CAC = ₹15,000 ÷ 5
Advertising CAC = ₹3,000
For a complete business calculation, include relevant sales and marketing expenses.
These might include:
- Advertising expenditure
- Sales team costs
- Marketing software
- Agency fees
- Other acquisition-related expenses
CAC is especially useful when evaluating whether advertising can support profitable growth.
11. What Is ROAS?
ROAS stands for Return on Ad Spend.
It compares the revenue attributed to advertising with the advertising expenditure.
Formula
ROAS = Attributed Revenue ÷ Advertising Spend
Example
Advertising spend: ₹20,000
Attributed revenue: ₹80,000
ROAS = ₹80,000 ÷ ₹20,000
ROAS = 4:1
This means the campaign generated ₹4 in attributed revenue for every ₹1 spent on advertising, according to the selected measurement method.
However, ROAS is not profit.
You still need to account for:
- Product costs
- Shipping
- Discounts
- Returns
- Payment fees
- Staff expenses
- Other operating costs
A campaign with a high reported ROAS can still be unprofitable if its margins are low.
For service businesses, you may need a CRM or sales tracking system to connect leads with actual revenue.
12. Which Meta Ads Metrics Matter Most?
The most important metrics depend on your campaign objective.
| Campaign Objective | Useful Metrics |
|---|---|
| Awareness | Reach, impressions, frequency, CPM |
| Traffic | Link clicks, link CTR, CPC, landing page views |
| Video engagement | Video viewing metrics, engagement, cost per result |
| Lead generation | Leads, CPL, qualified leads, CAC |
| E-commerce sales | Purchases, cost per purchase, revenue, ROAS |
| Retargeting | Conversions, frequency, cost per result |
| Customer acquisition | New customers, CAC, contribution margin |
Don’t try to optimize every metric simultaneously.
Choose the primary business outcome first, then use supporting metrics to diagnose performance.
13. How to Read Meta Ads Analytics for Lead Generation
Let’s take a fictional digital marketing agency based in Kolkata.
The agency spends ₹12,000 on a Meta Ads campaign.
Its results are:
| Metric | Result |
|---|---|
| Advertising spend | ₹12,000 |
| Link clicks | 600 |
| Landing page views | 480 |
| Leads | 40 |
| Qualified leads | 16 |
| New customers | 4 |
Now calculate the important metrics.
Cost Per Lead
₹12,000 ÷ 40 = ₹300
Cost Per Qualified Lead
₹12,000 ÷ 16 = ₹750
Advertising Cost Per Customer
₹12,000 ÷ 4 = ₹3,000
These figures reveal more than the total number of leads.
The business can now compare its acquisition cost with the revenue and profit generated by those customers.
It can also investigate why 24 of the 40 leads did not qualify.
Possible causes include:
- The offer attracts the wrong audience.
- The advertisement is unclear.
- The lead form lacks qualifying questions.
- The service price doesn’t match expectations.
- The business is targeting too broadly for its needs.
The numbers help identify where to investigate next.
Read Also: Google Ads vs Meta Ads
14. How to Read Meta Ads Analytics for E-Commerce
For an online store, a useful report might include:
| Metric | Example |
|---|---|
| Advertising spend | ₹10,000 |
| Purchases | 25 |
| Average order value | ₹1,200 |
| Attributed revenue | ₹30,000 |
| Cost per purchase | ₹400 |
| Reported ROAS | 3:1 |
The calculations are:
Cost Per Purchase = ₹10,000 ÷ 25 = ₹400
ROAS = ₹30,000 ÷ ₹10,000 = 3:1
These are hypothetical figures.
Before deciding whether the campaign is profitable, calculate product margins and other costs.
You should also check whether the purchase events and revenue values are recorded correctly.
15. Understand Meta Ads Attribution
Attribution is the process of assigning credit for a conversion to one or more marketing interactions.
For example, a person might:
- See a Facebook advertisement.
- Visit the website later.
- Search for the business on Google.
- Return to the website.
- Make a purchase.
Which channel deserves credit?
The answer depends on the attribution method being used.
Meta’s reporting may attribute conversions according to the campaign’s available attribution settings and reporting methodology.
Other analytics platforms may report different figures because they use different attribution rules, identifiers and measurement methods.
Important Distinction
Attributed conversions are not necessarily incremental conversions.
A purchase attributed to an advertisement doesn’t automatically mean the advertisement caused the purchase.
For larger campaigns, incrementality testing can help estimate whether advertising generated additional outcomes beyond what would have happened otherwise.
16. Why Meta and Google Analytics Numbers May Differ
It’s common for advertising platforms and analytics tools to report different figures.
Possible reasons include:
- Different attribution models
- Different attribution windows
- Consent choices
- Browser restrictions
- Ad blockers
- Cross-device activity
- Time-zone differences
- Event configuration
- Duplicate or missing events
- Different definitions of a conversion
For example, Meta might attribute a purchase to an advertisement, while another analytics platform attributes the same purchase to a different channel.
This doesn’t automatically mean either system is broken.
What Should You Do?
- Check the reporting periods.
- Compare time zones.
- Review attribution settings.
- Verify conversion events.
- Check for duplicate events.
- Compare platform reports with actual orders or CRM records.
- Document the differences.
Don’t simply add conversion counts from different platforms together. The same customer action may appear in multiple reports.
17. Meta Pixel and Conversions API Analytics
For website campaigns, tracking implementation is essential.
Meta Pixel can help report eligible website events.
The Conversions API can send eligible event information from supported business systems to Meta.
Depending on your setup, these tools may support measurement of actions such as:
- Page views
- Product views
- Add-to-cart events
- Lead submissions
- Purchases
However, tracking isn’t always complete.
Browser restrictions, consent choices, technical errors and other limitations can affect the data.
Tracking Checklist
- Important events are configured.
- Events fire when the intended action occurs.
- Purchase values and currencies are correct.
- Duplicate events are handled appropriately.
- Website forms are tested.
- Purchase records are compared with actual orders.
- Privacy requirements are followed.
Don’t send unnecessary sensitive information to advertising platforms.
Tracking implementation should respect applicable laws, platform policies and user privacy choices.
18. Use UTM Parameters to Understand Campaign Traffic
UTM parameters are tags added to destination URLs to help analytics tools identify traffic sources and campaigns.
For example, a URL might contain:
utm_source=facebook
utm_medium=paid_social
utm_campaign=website_leads_oct_2026
utm_content=video_problem_hook
These tags can help distinguish campaign traffic and creative variations in supported analytics reports.
Example Naming Structure
| Parameter | Example |
|---|---|
utm_source | |
utm_medium | paid_social |
utm_campaign | website_leads_oct_2026 |
utm_content | video_problem_hook |
Use consistent naming conventions.
If one campaign is labelled FB_Leads and another is labelled facebook_lead_campaign_oct, reporting becomes harder to organize.
UTMs complement platform reporting; they do not replace conversion tracking or prove that a campaign caused a sale.
19. Build a Simple Meta Ads Reporting Dashboard
You don’t need a complicated analytics system to begin.
A spreadsheet can provide a useful overview of campaign performance.
Consider these columns:
| Date | Campaign | Spend | Leads | Qualified Leads | Customers | CPL | Customer Acquisition Cost |
|---|---|---|---|---|---|---|---|
| 1 Oct | Website Leads | ₹500 | 5 | 2 | 1 | ₹100 | ₹500 |
| 2 Oct | Website Leads | ₹500 | 4 | 1 | 0 | ₹125 | — |
| 3 Oct | Website Leads | ₹500 | 6 | 3 | 1 | ₹83.33 | ₹500 |
The figures are illustrative. The table uses advertising spend for its simple acquisition-cost calculation; include other relevant sales and marketing expenses for a fuller CAC measure.
A reporting dashboard can help you compare campaigns over time and identify patterns.
For client reporting, include a short explanation of what the numbers mean rather than presenting metrics without context.
20. How to Diagnose Common Meta Ads Problems
Analytics becomes more useful when you connect a metric with a question.
Problem 1: High CPM
Possible investigation:
- Has the audience changed?
- Has competition increased?
- Is the campaign targeting a limited audience?
- Has the delivery environment changed?
A high CPM doesn’t automatically mean the campaign is performing poorly.
Problem 2: Low Link CTR
Possible investigation:
- Is the hook relevant?
- Is the offer clear?
- Does the creative stand out?
- Does the advertisement match the audience?
Problem 3: High CPC
Possible investigation:
- Is the campaign attracting enough relevant clicks?
- Is the creative compelling?
- Is the CTR weak?
- Has the campaign objective been chosen appropriately?
Problem 4: Many Clicks but Few Landing Page Views
Possible investigation:
- Does the page load properly?
- Are redirects working?
- Is the page slow on mobile?
- Is the tracking configuration correct?
Problem 5: Many Landing Page Views but Few Leads
Possible investigation:
- Is the landing page clear?
- Is the offer relevant?
- Is the CTA visible?
- Is the form too complicated?
- Is the audience appropriate?
Problem 6: Many Leads but Few Customers
Possible investigation:
- Are the leads qualified?
- Is the offer attracting the right people?
- Is follow-up fast enough?
- Is the pricing appropriate?
- Does the sales process need improvement?
The goal is to investigate the cause instead of automatically changing the budget.
21. Common Meta Ads Analytics Mistakes
Mistake 1: Measuring Only Likes
Engagement can be useful, but it doesn’t necessarily indicate sales performance.
Mistake 2: Comparing Different Objectives
An awareness campaign and a lead-generation campaign should not be judged using identical primary metrics.
Mistake 3: Ignoring Lead Quality
Low CPL may hide poor-quality enquiries.
Mistake 4: Treating ROAS as Profit
Revenue and profit are different measurements.
Mistake 5: Ignoring Attribution Differences
Different platforms may assign credit differently.
Mistake 6: Making Decisions From Tiny Samples
A small number of clicks or conversions may not provide reliable evidence.
Mistake 7: Changing Everything at Once
Changing audience, creative, budget and landing page simultaneously makes it harder to understand what affected performance.
Mistake 8: Ignoring the Customer Journey
Advertising performance should be evaluated beyond the initial click.
Mistake 9: Trusting Every Tracked Event
Incorrect or duplicated events can distort reporting.
Mistake 10: Reporting Numbers Without Recommendations
A good report should explain what happened, why it might have happened and what to investigate next.
22. A Practical Weekly Meta Ads Analytics Routine
Use this routine to make campaign reviews more consistent.
Daily: Check for Critical Issues
Review:
- Unexpected spending
- Delivery problems
- Broken destination URLs
- Tracking failures
- New lead notifications
Avoid making major strategic changes simply because one day performs differently from another.
Weekly: Review Performance
Check:
- Spend
- Reach
- Impressions
- Frequency
- CTR
- CPC
- Leads
- Qualified leads
- Cost per result
- Landing-page performance
Look for meaningful patterns.
Monthly: Review Business Results
Evaluate:
- Total advertising spend
- Customers acquired
- Customer acquisition cost
- Attributed revenue
- Contribution margin
- Lead quality
- Campaign contribution
- Next month’s budget
Use these findings to guide the next round of testing and optimization.
Read Also: Meta Ads Creative Strategy
Meta Ads Analytics Checklist
Before making an important advertising decision, ask:
Campaign Measurement
- Is the campaign objective clear?
- Are the right metrics being monitored?
- Is the reporting period correct?
- Are campaign comparisons meaningful?
Click and Traffic Analysis
- Are clicks relevant?
- Is landing-page traffic being recorded?
- Does the website work properly on mobile?
- Are UTMs consistent?
Conversion Tracking
- Are leads and purchases tracked correctly?
- Are duplicate events handled?
- Are purchase values accurate?
- Are privacy requirements respected?
Business Performance
- Is lead quality being measured?
- Is customer acquisition cost understood?
- Is revenue being connected to customers where possible?
- Are margins considered alongside ROAS?
Optimization
- Are conclusions based on sufficient data?
- Are changes made deliberately?
- Are recommendations connected to business goals?
- Is performance reviewed over time?
Final Thoughts
Meta Ads analytics is about turning advertising data into better decisions.
Reach, impressions, clicks, CTR, CPC, CPL and ROAS can all provide useful information. But none of these metrics tells the complete story on its own.
A successful analytics process connects the advertisement with the customer’s journey and the business outcome.
For lead generation, measure qualified enquiries and customer acquisition costs.
For e-commerce, measure purchases, revenue and profitability.
For every campaign, verify tracking, understand attribution limitations and investigate the reasons behind performance changes.
Use this process:
Measure → Understand → Diagnose → Improve → Measure Again
When you consistently evaluate the right metrics, you’ll be better equipped to manage your advertising budget, explain campaign performance and identify opportunities for improvement.
Frequently Asked Questions
1. What is Meta Ads analytics?
Meta Ads analytics is the process of measuring and evaluating Facebook and Instagram advertising data to understand campaign performance and support better marketing decisions.
2. What are the most important Meta Ads metrics?
The most important metrics depend on the campaign objective. Common examples include reach, impressions, frequency, CTR, CPC, CPM, CPL, conversion rate, customer acquisition cost and ROAS.
3. What is a good CTR for Meta Ads?
There is no universal CTR benchmark for every industry, placement and objective. Compare relevant campaigns using the same CTR definition and evaluate the results alongside conversion quality.
4. How do I calculate Meta Ads cost per lead?
Divide the advertising expenditure by the number of leads generated during the selected period.
For example, ₹5,000 in spend divided by 25 leads equals ₹200 per lead.
5. What is the difference between CPC and CPM?
CPC measures the cost per relevant click, while CPM measures the cost per 1,000 impressions.
6. What is ROAS in Meta Ads?
ROAS compares revenue attributed to advertising with advertising expenditure. It does not directly measure profit.
7. Why are Meta Ads and Google Analytics showing different conversions?
The platforms may use different attribution methods, reporting windows, time zones, identifiers and event-measurement approaches. Review these differences before drawing conclusions.
8. Do I need Meta Pixel for analytics?
Website-based conversion measurement often uses Meta Pixel or another supported integration. The appropriate setup depends on the campaign, website and available tracking options.
9. How often should I review Meta Ads analytics?
Check critical technical issues regularly, review campaign patterns weekly and evaluate broader business outcomes monthly. The exact schedule depends on campaign size and complexity.
10. Can Meta Ads analytics guarantee better results?
No. Analytics helps you understand performance and make informed decisions, but results depend on the audience, offer, creative, website experience, competition and sales process.